Our services
A systematic approach

The study protocol
We produce a document that describes the method of the proposed study, from justification to objectives, from hypothesis to methodological constraints, and that defines its conditions of realization and its conduct. The study protocol contains:
- A title page;
- A summary;
- A table of contents;
- An introduction;
- The objectives of the study;
- Methods;
- Selection of participants, including inclusion and Exclusion criteria;
- Recruitment of participants;
- Informed consent of participants;
- Screening procedures among others;
- Replacement of participants;
- Treatment;
- Any concomitant treatment if any;
- The activities and observations that will be made;
- Instructions for treatment-related side effects;
- Data collection;
- Quality assurance measures such as training and monitoring of Participants;
- The analysis plan;
- Risks and benefits;
- Supporting references;
- The annexes which will finally include any detailed information likely to burden the Protocol
Data collection
We use the systematic approach of gathering and measuring information from a variety of sources to obtain a complete and accurate view of an area of interest. Data collection allows an individual or company to answer relevant questions, evaluate outcomes, and better anticipate future probabilities and trends. Accuracy is required in data collection to ensure study integrity, informed decision-making, and quality assurance. It is for this reason that we collect data with state-of-the-art equipment, including the geolocated information system.

Data collection method :
- Interviews
- Questionnaires and surveys
- Observation
- Documents and records
- Focus Groups
- Oral histories
The data collection tools used include :
- ODK collect,
- ArcGIS Survey123
- Kobo collect
- Survey CTOcollect
- Mobile Forms App – Zoho Forms
- Mobile Data Collection
- ArcGIS Field Maps
- CommCare
- Epicollect5

Statistical Data Analysis
We use statistical and logical techniques to describe the scope of data, modulate data structure, condense data representation, illustrate data with images, tables, and graphs, and evaluate statistical bias, probability data, to draw meaningful conclusions.
Statistical analysis is the technique of performing various statistical operations to quantify data and apply statistical analysis. Quantitative data involves descriptive data such as surveys and observational data. It is also called descriptive analysis. It includes various tools for performing statistical data analysis, such as:
- MICROSOFT EXCEL
- STATA
- IBM SPSS STATISTICS
- R
- SAS
- STATISTICA
- STATISTIX
- MATLAB
- MaxStat
- AcaStat
- Jasp stats
- Statwing
- Minitab
- GraphPad Prism
- JMP
- Epi-Info
Data visualization
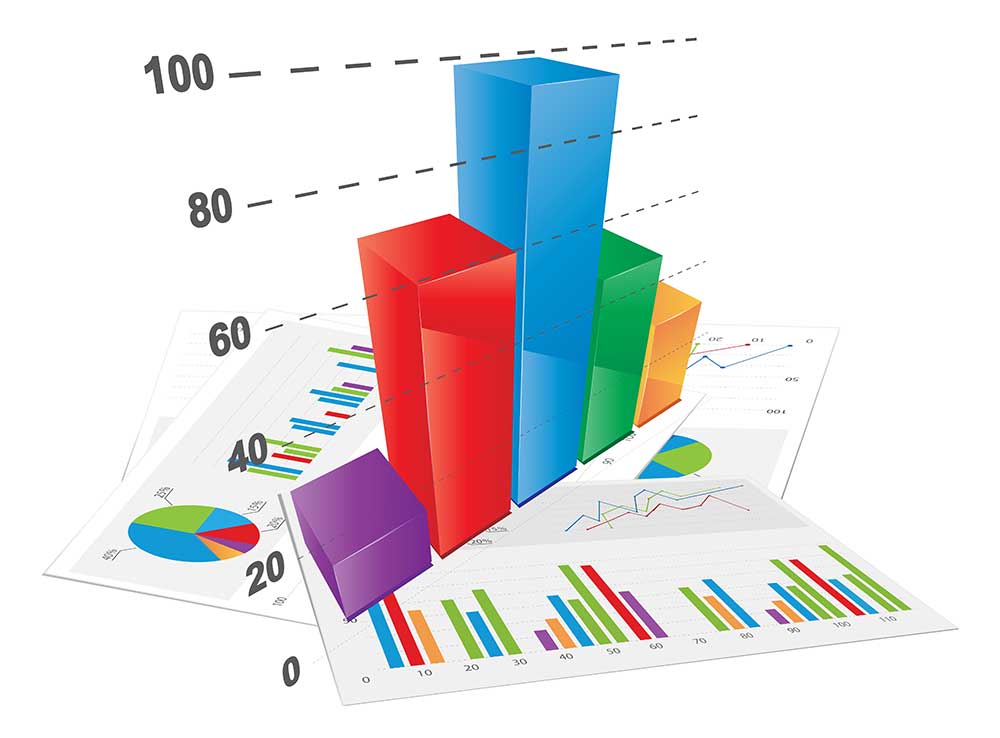
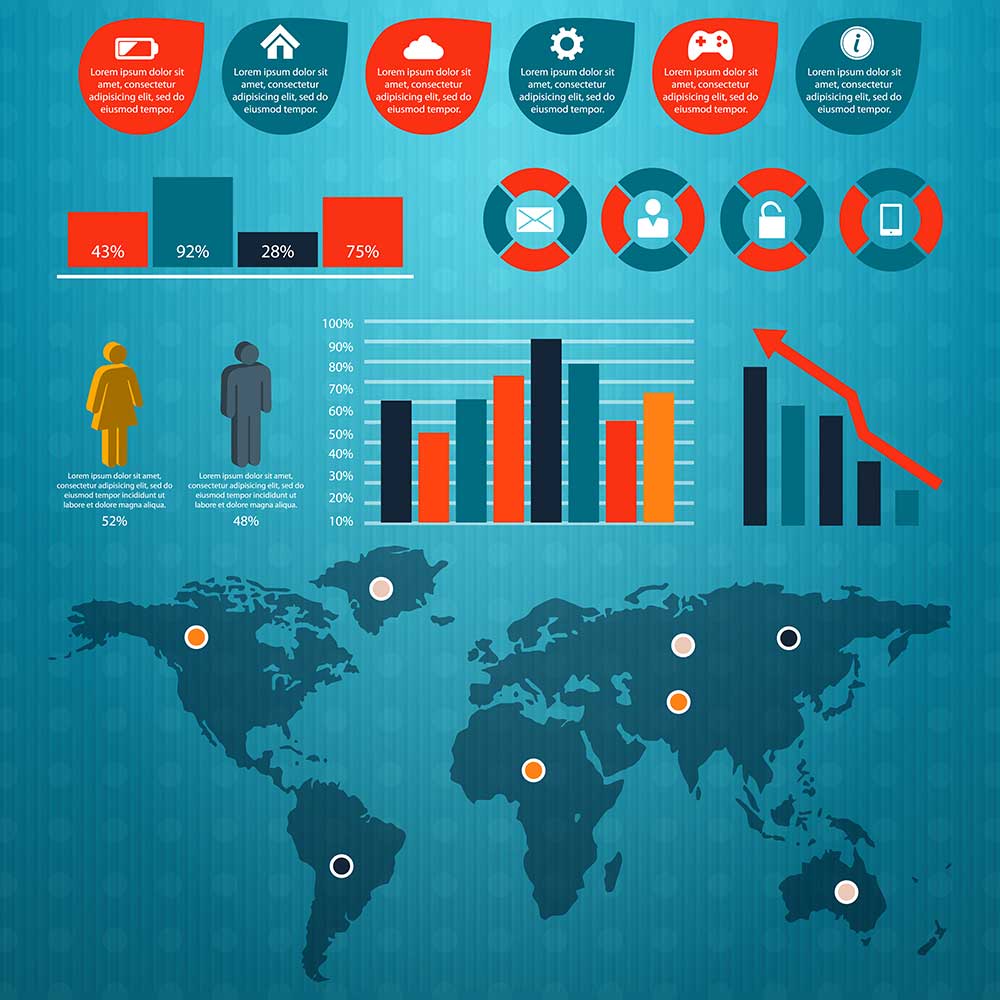
We visually represent the data to be able to detect and understand the information, the raw data being difficult to interpret and exploit. This process is done by specific analytical tools and is materialized by tables (Excel type), graphs, visual maps or even infographics grouped in Dashboards (dashboards).
The most popular visualizations:
- Pie charts
- Table (with texts or numbers)
- Curve
- Histogram (bar chart)
- Cartography
- Computer graphics
- Timeline
- Area chart
- Box of whiskers
- Compartmentalization
- Scatterplot, word, or bubble cloud
- Circular view
- Classic or radial tree
- Gantt chart
- Heat map
- Matrix
- Waterfall
- Funnel
- Network
- Polar chart
The different data analysis and dashboard tools: :
- Klipfolio
- Geckoboard
- Cyfe
- SiSense
- GoodData
- Birst
- Qlik
- Tableau
- Domo

Data interpretation
We build a compelling narrative based on complex data and analysis to convey your narrative and thus influence and inform a particular audience. Data interpretation is very similar to human storytelling, but it has the advantage of offering deeper insights and providing evidence through graphs and tables. With data interpretation, complex information is simplified so your audience can interact with your content and make critical decisions faster and with confidence.

